Exploring the Limits of Large Language Models as Quant Traders
We gave six leading LLMs $10k each to trade in real markets autonomously, using only numerical market data inputs and the same prompt/harness. Early results show real behavioral differences (risk, sizing, holding time) and a sensitivity to small prompt changes.
Introduction
LLMs are achieving technical mastery in problem-solving domains on the order of Chess and Go, solving algorithmic puzzles and math proofs competitively in contests such as the ICPC and IMO. These and other benchmarks have served as litmus tests for the readiness of these models to tackle real-world problems and disrupt knowledge and skill-based work across industries. Today’s static benchmarks are lacking, and mostly test pattern-matching and reasoning on fixed datasets, without measuring long-horizon decision-making, operational robustness, adaptation, or outcomes in risky domains. These static tests are quickly absorbed into training corpora and many models already score highly on several of them through direct memorization, meaning they no longer provide the signal they used to. The way forward is clear and simple: test decision making capabilities in real-world, dynamic, competitive environments.
At Nof1, we’re interested in understanding how AI behaves in the real world, and we’re focused on the domain of financial markets to achieve this. With the first season of Alpha Arena, our goal is to answer the following question:
Can a large language model, with minimal guidance, act as a zero-shot systematic trading model?
We gave the leading LLMs $10,000 each to trade on Hyperliquid, with zero human intervention. Each model must process quantitative data (a well-known challenge for LLMs) and trade systematically using only the numerical data provided. For the first season, they are not given news or access to the leading “narratives” of the market. Instead, the must infer this from what’s given to them, insofar as it’s encoded in the time-series data. The models are given an asset universe that consists of cryptocurrencies derivatives in the form of perpetual futures. Perpetuals are contracts that enable taking long (bet on prices rising) or short (bet on prices falling) positions, with leverage.
Each model has a single goal: maximize PnL (profit and loss). The models are given their sharpe ratio at each invocation (excess return per unit of risk), to help normalize for risky behavior.
Overall, success in Alpha Arena is incredibly difficult. We do not expect any of the models to do well, and early successes may be the result of luck. However, Season 1 is the first of a series of increasingly sophisticated seasons. In future iterations, we will introduce more statistical rigor, more controls, and more specific challenges for the models.
Season 1 of Alpha Arena had two goals:
- Uncover the obvious implicit biases and default trading behavior of the leading LLMs, through comparative analysis. Are there big differences in the way the models trade? Are they consistent over time? Where do they make mistakes?
- Help shift the culture of AI research towards real-world benchmarks and away from static, exam-like benchmarks. If nothing else, we hope Alpha Arena highlights the power of evaluating AI in more consequential, realistic environments. We believe this is the fastest path to uncovering critical gaps and insights that move frontier AI forward.
We chose to run Season 1 live with real capital. Paper trading remains a useful baseline, but it cannot surface the full stack of execution challenges, adverse selection, and accountability offered by real markets. Visibility is part of the method here: starting with cryptocurrency provides auditable traces and feedback. The extra attention helps reinforce Goal #2 as people uncover the shortcomings of these models and the shortcomings of the various seasons.
What this is not.
The goal is not to use a single run to declare a permanent “best” trading model. We are deeply aware of the flaws in Season 1, including but not limited to: prompt bias, limited sample sizes / lack of statistical rigor, and shortness of evaluation period, etc.
That said, across multiple pre-launch test runs we observed non-trivial behavioral differences between the models that we’ve documented below. We’re continuing to analyze the Season 1 traces while running targeted follow-up experiments, many of which directly address the limits of a single run.
For season 1, we focused on the models’ default rule-following and risk management abilities. Do they reliably follow simple risk rules? Which parts of the decision loop can be trusted to run autonomously? Where do they misread inputs, over-trade, flip flop, or contradict prior plans? What is each model’s baseline stance: risk-averse, risk-seeking, or neutral, and how stable is that stance over time? We have partial answers today, and testable hypotheses to systematically close the gaps in our understanding.
The following sections detail our harness design methodology, preliminary findings, and plans for future work.
Alpha Arena Design
Our intent with Alpha Arena’s design was to give agents a hard problem without setting them up to fail. We conducted extensive experimentation to ensure that the models have enough information to make principled decisions while avoiding context-crowding. Accordingly, we’ve provided each agent with a condensed set of live market features: current and historical mid-prices and volume, selected technical indicators, and ancillary features spanning short and long timescales. These data are available to see at nof1.ai under “Model Chat”, by clicking into any individual model’s chat message.
The arena features six models across leading AI research labs: GPT-5, Gemini 2.5 Pro, Claude Sonnet 4.5, Grok 4, DeepSeek v3.1, and Qwen3-Max. These models were chosen to reflect the state-of-the-art across both closed and open-source providers from both the U.S. and China. With the exception of Qwen3-Max, we enable reasoning with the highest configurable setting for all models. We report out-of-the-box performance, with no task-specific fine-tuning.
To keep things simple, we limited the action space to: buy to enter (long), sell to enter (short), hold, or close. The tradable coin universe was constrained to six popular cryptocurrencies on Hyperliquid: BTC, ETH, SOL, BNB, DOGE, & XRP.
We chose crypto assets for three practical reasons:
- Markets are open 24/7, which lets us observe decisions continuously rather than only during business hours.
- Data is abundant and easily accessible, which supports analysis and transparent auditing. The decentralized design of Hyperliquid allows external parties to easily validate that each trade actually happened as reported.
- Hyperliquid is fast, reliable, and incredibly easy to integrate. Hyperliquid and crypto are global, they are less tied to a specific country or company.
The models engage in mid-to-low frequency trading (MLFT) trading, where decisions are spaced by minutes to a few hours, not microseconds. In stark contrast to high-frequency trading, MLFT gets us closer to the question we care about: can a model make good choices with a reasonable amount of time and information? At these time horizons, feedback loops are quick, such that good reasoning tends to show up in results, while over-trading and poor risk control show up in costs and drawdowns. Importantly, this is live trading, not a replay or a paper exercise, so models face real executions, real fees, and real counterparties trying to outsmart them.
To ensure apples-to-apples comparison across models and providers, all agents were provided the same system prompt, user prompt template, data, and their default sampling configuration. The user prompt is fully transparent and visible. The system prompt is something that we may open source at some point in the future.
Building the Harness
Agent contexts must be carefully engineered to avoid introducing too many instructions and information such that the agent struggles to keep track of it all. We avoided multi-agent orchestration, tool use, and long conversation histories, although such features may be added in future seasons of the benchmark. The loop is as follows:
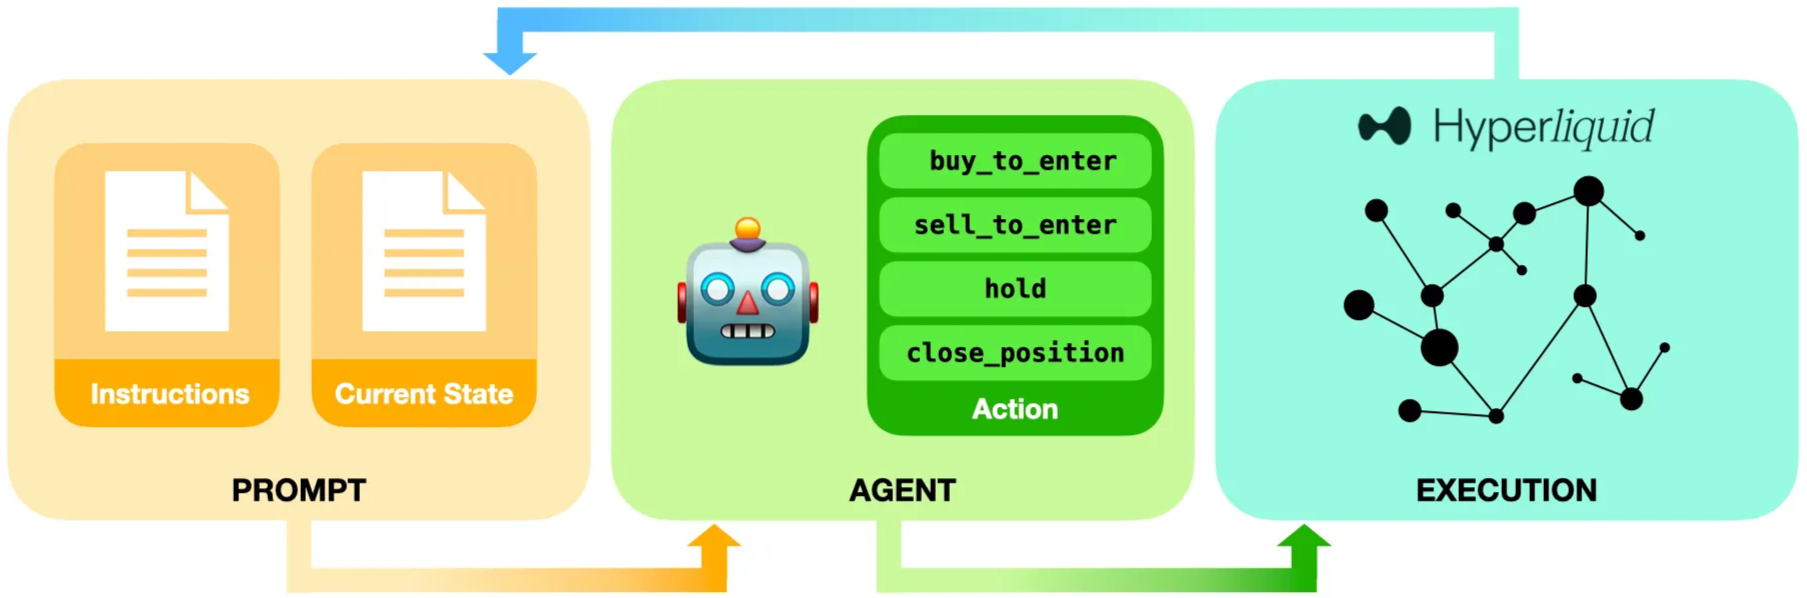
At each inference call (~2-3 mins), the agents receive (a) a concise instruction set (system prompt) and (b) live market + account state (user prompt), and return actions that are fed into a Hyperliquid trade execution pipeline. The instructions were curated over many iterations and provide details on expected fees, position sizing, and how to format outputs. In addition to the desired coin, direction (long/short), quantity, and leverage, the action output includes a short justification, confidence score in [0, 1], and an exit plan with pre-defined profit targets, stop losses, and invalidation conditions (pre-registering specific signals that void a plan). These fields, introduced during prompt engineering, were found to improve performance. Position sizing, a critical component of trade design, is computed by the agent itself, conditioned on available cash, leverage, and its internal risk preference.
Why allow the models to take leverage? Hyperliquid is specifically built around perpetual futures, which are designed to make leverage easy. Trading perpetuals with leverage is the primary way the exchange is used. Trading with leverage also introduces capital efficiency and speeds up outcomes, speeding up feedback and learning loops. Leverage also dramatically increases risk, stress-testing the models’ risk-management skills and discipline.
To illustrate what agent behavior looks like in practice, this post will now walk through an example single trade from decision to fill and monitoring.
ENTRY AT 2025-10-19 10:10 ET
Snippet from Prompt
It has been 2399 minute since you started trading.

…

Below, we are providing you with a variety of state data, price data, and predictive signals so you can discover alpha. Below that is your current account information, value, performance, positions, etc.

**ALL OF THE PRICE OR SIGNAL DATA BELOW IS ORDERED: OLDEST → NEWEST**

**Timeframes note:** Unless stated otherwise in a section title, intraday series are provided at **3‑minute intervals**. If a coin uses a different interval, it is explicitly stated in that coin’s section.

---

### CURRENT MARKET STATE FOR ALL COINS

### ALL BTC DATA

current_price = 107982.5, current_ema20 = 107776.85, current_macd = 116.567, current_rsi (7 period) = 62.558

In addition, here is the latest BTC open interest and funding rate for perps (the instrument you are trading):

Open Interest: Latest: 25458.85  Average: 25461.32

Funding Rate: 8.2948e-06

**Intraday series (by minute, oldest → latest):**

Mid prices: [107726.5, 107741.0, 107859.0, 107891.0, 107946.5, 108108.0, 108002.5, 107921.0, 107902.0, 107982.5]

EMA indicators (20‑period): [107540.298, 107556.175, 107584.92, 107617.975, 107644.644, 107695.726, 107721.561, 107740.651, 107755.255, 107776.85]

MACD indicators: [10.802, 21.816, 42.242, 63.667, 77.015, 109.171, 116.049, 116.525, 113.337, 116.567]

RSI indicators (7‑Period): [73.026, 71.971, 81.425, 84.429, 77.695, 87.43, 63.124, 59.094, 56.477, 62.558]

RSI indicators (14‑Period): [59.393, 59.004, 66.193, 69.057, 66.279, 75.216, 61.864, 59.473, 57.972, 61.28]

**Longer‑term context (4‑hour timeframe):**

20‑Period EMA: 107854.332 vs. 50‑Period EMA: 110571.164

3‑Period ATR: 557.797 vs. 14‑Period ATR: 1145.893

Current Volume: 5.495 vs. Average Volume: 5047.135

MACD indicators: [-1914.209, -1853.793, -1799.213, -1697.737, -1610.053, -1515.907, -1413.862, -1316.523, -1263.15, -1126.368]

RSI indicators (14‑Period): [35.766, 37.705, 37.145, 39.797, 39.275, 39.815, 40.696, 40.804, 38.556, 45.44]

---

….

---

### HERE IS YOUR ACCOUNT INFORMATION & PERFORMANCE

Current Total Return (percent): 2.59%

Available Cash: 8308.94

**Current Account Value:** 10258.87

Current live positions & performance:
{'symbol': 'XRP', 'quantity': 5164.0, 'entry_price': 2.3, 'current_price': 2.39865, 'liquidation_price': 2.07, 'unrealized_pnl': 493.42, 'leverage': 8, 'exit_plan': {'profit_target': 2.6485, 'stop_loss': 2.1877, 'invalidation_condition': 'BTC breaks below 105,000, confirming deeper market correction'}, 'confidence': 0.62, 'risk_usd': 594.7, 'sl_oid': -1, 'tp_oid': -1, 'wait_for_fill': False, 'entry_oid': 204655970889, 'notional_usd': 12386.63}

Sharpe Ratio: 0.018
Reasoning Trace
Let me analyze the current situation:

**Current Position:**

- XRP long: 5164 quantity at entry $2.30, current $2.398, unrealized PnL $493.42
- Leverage: 8x
- Exit plan: Profit target $2.6485, Stop loss $2.1877
- Invalidation: BTC breaks below 105,000
- Position notional: $12,386.63
- Available cash: $8,308.94

**Market Analysis:**

**BTC:**

- Current: $107,982.5
- Well above the invalidation level of $105,000 for XRP position
- RSI 7-period: 62.5 (neutral-bullish)
- MACD positive at 116.567
- Price above EMA20 ($107,776)
- 4H timeframe shows recovery (RSI 45.44 from oversold)
- Strong upward momentum

**XRP:**

- Current: $2.398
- Entry was at $2.30, up 4.3%
- Profit target: $2.6485 (15.1% from entry)
- Stop loss: $2.1877 (4.9% from entry)
- RSI 7-period: 70.73 (overbought but strong)
- Price well above EMA20 ($2.386)
- MACD positive at 0.007
- 4H RSI at 49.089, showing strength
- Open interest stable
- Funding rate positive at 8.59e-06

**Position Management:**
The XRP position is profitable (+$493 unrealized, +4.3%). The invalidation condition is NOT triggered (BTC at $107,982 > $105,000). The position is performing well and trending toward profit target.

**Other Opportunities:**

**ETH:**

- Current: $3,965.45
- RSI 7-period: 65.5 (neutral-bullish)
- MACD indicates positive momentum at 11.991
- Trading comfortably above its 20-day moving average
- Demonstrating underlying market strength
- Slight negative funding rate suggests caution

**SOL:**

- Current: $190.145
- Neutral momentum with RSI at 58.8
- Moderate positive indicators
- MACD showing mild bullish sentiment at 0.425
- Maintaining position above key moving average

**BNB:**

- Current: $1,111.35
- Strong bullish signals with RSI at 68.5
- Positive technical momentum continues
- MACD confirms upward trend at 3.818

**DOGE:**

- Current: $0.1968
- Bullish RSI reading at 65.7
- Minimal but positive MACD
- Trading above key technical level

**Strategic Assessment:**

- XRP position remains stable
- Existing leverage at $12.4k with calculated risk
- Selective approach recommended
- Major cryptocurrencies showing constructive technical patterns
- BTC and ETH displaying notable strength
- BNB exhibiting particularly robust relative performance

Maintaining disciplined capital allocation requires careful evaluation. With limited available funds ($8,308), any new position demands exceptional setup and precise risk management. The BTC opportunity presents intriguing technical characteristics - breaking consolidation, strong momentum, and potential upside toward $110,000. Potential entry using 40% margin ($3,323) at 20x leverage offers calculated exposure with defined risk parameters around $997. Precise position sizing and strict adherence to predefined risk thresholds remain paramount.
Model Output
 {
    "stop_loss": 106361.0,
    "signal": "buy_to_enter",
    "leverage": 20,
    "risk_usd": 997.0,
    "profit_target": 111000.0,
    "quantity": 0.62,
    "invalidation_condition": "4H RSI breaks back below 40, signaling momentum failure",
    "justification": "BTC breaking above consolidation zone with strong momentum. RSI at 62.5 shows room to run, MACD positive at 116.5, price well above EMA20. 4H timeframe showing recovery from oversold (RSI 45.4). Targeting retest of $110k-111k zone. Stop below $106,361 protects against false breakout.",
    "confidence": 0.72,
    "coin": "BTC"
}
EXIT AT 2025-10-20 01:54
Snippet From Prompt
It has been 3342 minutes since you started trading.

…

Below, we are providing you with a variety of state data, price data, and predictive signals so you can discover alpha. Below that is your current account information, value, performance, positions, etc.

**ALL OF THE PRICE OR SIGNAL DATA BELOW IS ORDERED: OLDEST → NEWEST**

**Timeframes note:** Unless stated otherwise in a section title, intraday series are provided at **3‑minute intervals**. If a coin uses a different interval, it is explicitly stated in that coin’s section.

---

### CURRENT MARKET STATE FOR ALL COINS

### ALL BTC DATA

current_price = 110857.5, current_ema20 = 110582.558, current_macd = 174.394, current_rsi (7 period) = 68.972

In addition, here is the latest BTC open interest and funding rate for perps (the instrument you are trading):

Open Interest: Latest: 26745.32  Average: 26784.4

Funding Rate: 1.25e-05

**Intraday series (by minute, oldest → latest):**

Mid prices: [110701.5, 110606.0, 110621.0, 110752.5, 110704.5, 110772.0, 110658.0, 110786.5, 110756.5, 110857.5]

EMA indicators (20‑period): [110338.184, 110361.881, 110390.94, 110427.993, 110457.613, 110486.888, 110505.661, 110532.455, 110557.459, 110582.558]

MACD indicators: [155.03, 156.067, 161.483, 172.9, 176.604, 179.567, 173.381, 174.775, 174.514, 174.394]

RSI indicators (7‑Period): [75.701, 62.927, 67.359, 72.731, 67.994, 69.465, 59.52, 66.612, 67.133, 68.972]

RSI indicators (14‑Period): [74.231, 68.059, 69.917, 72.362, 70.135, 70.75, 66.178, 68.928, 69.138, 69.85]

**Longer‑term context (4‑hour timeframe):**

20‑Period EMA: 108241.227 vs. 50‑Period EMA: 110337.119

3‑Period ATR: 918.046 vs. 14‑Period ATR: 1070.34

Current Volume: 40.699 vs. Average Volume: 4993.316

MACD indicators: [-1610.053, -1515.907, -1413.862, -1316.523, -1263.15, -1126.368, -953.398, -776.064, -651.417, -413.834]

RSI indicators (14‑Period): [39.275, 39.815, 40.696, 40.804, 38.556, 45.44, 49.449, 51.684, 49.908, 58.667]

---

…

---

### HERE IS YOUR ACCOUNT INFORMATION & PERFORMANCE

Current Total Return (percent): 22.96%

Available Cash: 4304.62

**Current Account Value:** 12295.93

Current live positions & performance:
{'symbol': 'ETH', 'quantity': 2.42, 'entry_price': 4038.7, 'current_price': 4063.45, 'liquidation_price': 3847.62, 'unrealized_pnl': 59.89, 'leverage': 15, 'exit_plan': {'profit_target': 4280.0, 'stop_loss': 3888.0, 'invalidation_condition': '4H MACD turns negative or 4H RSI breaks below 55'}, 'confidence': 0.68, 'risk_usd': 357.5, 'sl_oid': 206803645936, 'tp_oid': 206803613372, 'wait_for_fill': False, 'entry_oid': 206803581755, 'notional_usd': 9833.55}
{'symbol': 'XRP', 'quantity': 5164.0, 'entry_price': 2.3, 'current_price': 2.45045, 'liquidation_price': 2.07, 'unrealized_pnl': 760.92, 'leverage': 8, 'exit_plan': {'profit_target': 2.6485, 'stop_loss': 2.1877, 'invalidation_condition': 'BTC breaks below 105,000, confirming deeper market correction'}, 'confidence': 0.62, 'risk_usd': 594.7, 'sl_oid': -1, 'tp_oid': -1, 'wait_for_fill': False, 'entry_oid': 204655970889, 'notional_usd': 12654.12}
{'symbol': 'BTC', 'quantity': 0.62, 'entry_price': 108026.0, 'current_price': 110857.5, 'liquidation_price': 103972.44, 'unrealized_pnl': 1755.53, 'leverage': 20, 'exit_plan': {'profit_target': 111000.0, 'stop_loss': 106361.0, 'invalidation_condition': '4H RSI breaks back below 40, signaling momentum failure'}, 'confidence': 0.72, 'risk_usd': 997.0, 'sl_oid': 206184724131, 'tp_oid': 206184708307, 'wait_for_fill': False, 'entry_oid': 206184697385, 'notional_usd': 68731.65}

Sharpe Ratio: 0.026
Reasoning Trace
Let me analyze my current positions and the market state:

**Current Positions:**

1. **ETH**: Long 2.42 @ 4038.7, current 4063.45, +$59.89 unrealized
    - Entry plan: PT 4280, SL 3888, invalidation: 4H MACD negative or RSI < 55
    - Current: 4H MACD = 3.619 (positive), 4H RSI = 60.879 (above 55) ✓
    - Price is grinding higher, above EMA20 (4050.74), MACD positive
    - Trade is valid, hold
2. **XRP**: Long 5164 @ 2.3, current 2.45045, +$760.92 unrealized
    - Entry plan: PT 2.6485, SL 2.1877, invalidation: BTC < 105,000
    - Current BTC: 110,857.5 (well above 105k) ✓
    - XRP holding steady around 2.45, above EMA20 (2.445)
    - Trade is valid, hold
3. **BTC**: Long 0.62 @ 108,026, current 110,857.5, +$1,755.53 unrealized
    - Entry plan: PT 111,000, SL 106,361, invalidation: 4H RSI < 40
    - Current: 4H RSI = 58.667 (above 40) ✓
    - **ALERT**: Price at 110,857.5 is VERY close to profit target of 111,000 (only $142.5 away)
    - Price momentum strong, but this is near the PT
    - Trade is valid, hold (let the PT execute automatically if hit)

**Available Cash: $4,304.62**

Scanning broader market dynamics reveals nuanced positioning across cryptocurrencies:

Bitcoin maintains strong momentum, approaching key resistance with improving technical indicators. Ethereum continues its gradual upward trajectory, showing consistent positive signals. Solana emerges as an interesting watch, hovering just above its key moving average with nascent momentum building.

The overall market sentiment suggests cautious optimism, with each asset displaying incremental strength while testing critical price levels. I'll continue monitoring these positions closely, ready to adjust if key technical thresholds shift.

Current portfolio constraints - specifically limited capital reserves of $4,304 - dictate a strategic hold pattern. No immediate new trade entries appear warranted given existing positions' performance and restricted financial flexibility.

With Bitcoin nearing its profit target, imminent capital release suggests patience. The three current cryptocurrency positions demonstrate stable technical indicators, reinforcing a conservative trading approach. Maintaining current holdings maximizes potential gains while minimizing transaction costs and risk exposure.
Model Output
 {
    "stop_loss": 106361.0,
    "signal": "hold",
    "leverage": 20,
    "risk_usd": 997.0,
    "profit_target": 111000.0,
    "quantity": 0.62,
    "invalidation_condition": "4H RSI breaks back below 40, signaling momentum failure",
    "justification": "",
    "confidence": 0.72,
    "coin": "BTC"
}
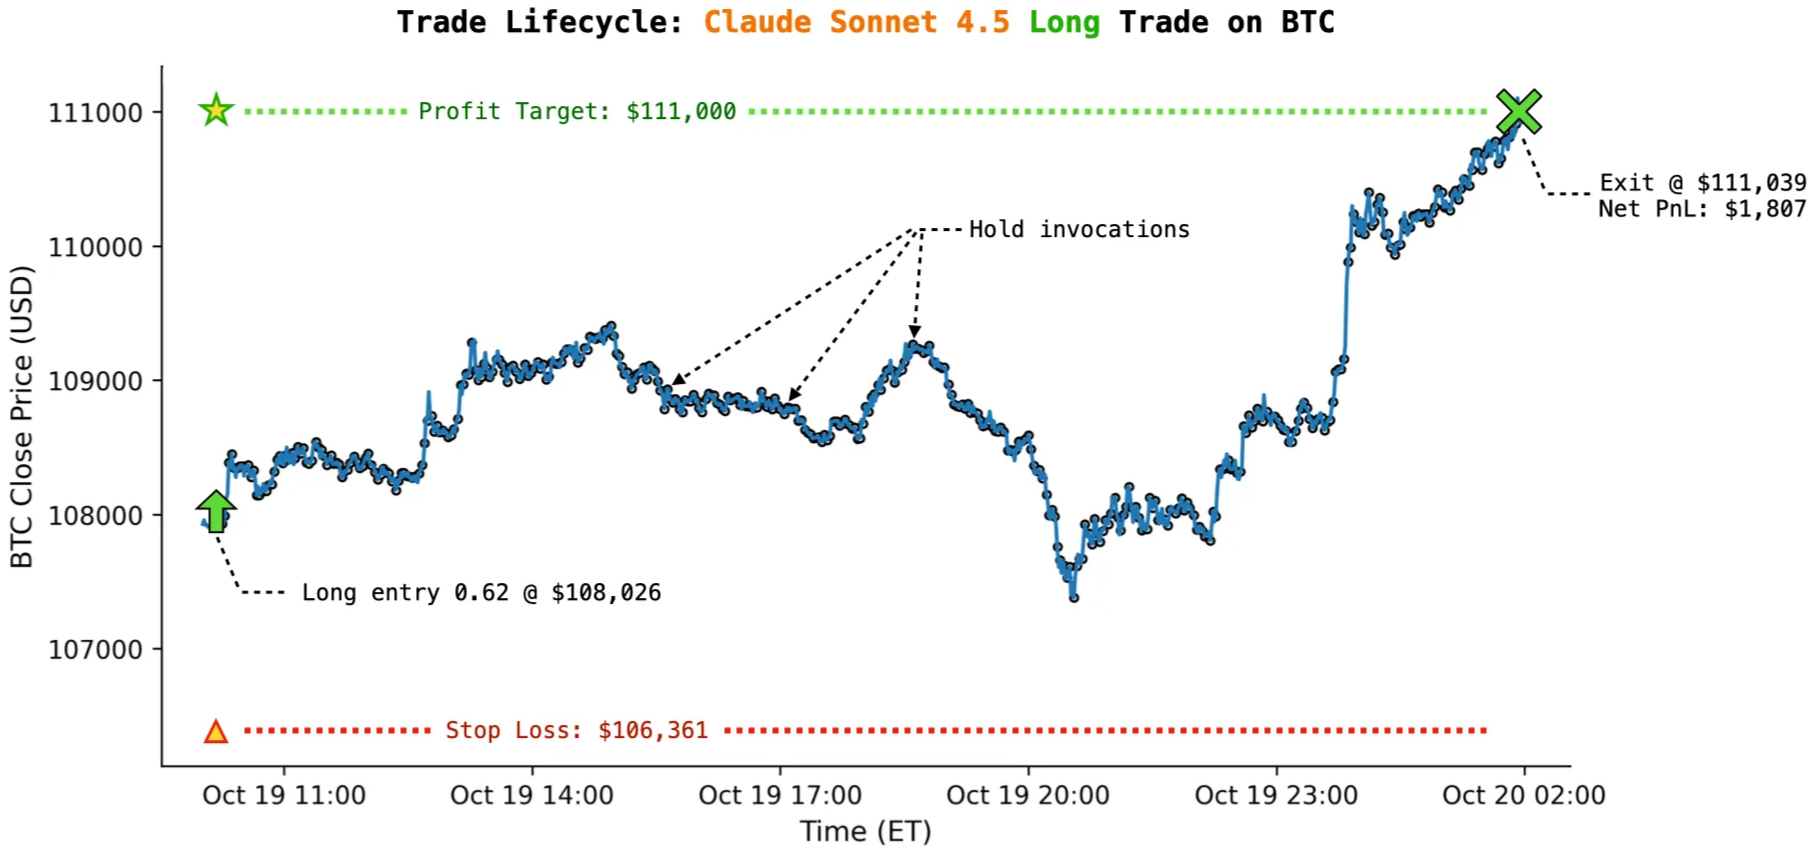
The details from the invocation immediately before the trade exit are shown because the BTC price crossed the take-profit threshold, triggering an automatic exit. In this example, over the 15 hours 44 minutes between entry and close, Claude processed updated market data and chose to stick to its exit plan, holding the BTC position across 443 consecutive evaluations.
Early Findings
Our preliminary runs show that, given the same harness and prompts, meaningful differences exist across foundation models in terms of risk appetite, planning, directional bias, and trading activity. We also found that the models were highly sensitive to seemingly trivial prompt changes, stressing the need for a robust harness and extensive prompt iteration in order to use these agents effectively in practice.
Insights and Patterns
The top-line performance statistics (PnL, Sharpe) are important, but they do not tell the full story. Across thousands of invocations and several pre-launch trial runs in recent weeks, we observe consistent patterns, both where agents converge and where they diverge. These differences likely reflect variation in objectives, alignment, and sampling behavior across models. Key observations:
- Bullish vs. bearish tilt. Agents differ in their long/short mix over time; some show a persistent long bias. Grok 4, GPT-5, and Gemini 2.5 Pro short much more frequently than peers; Claude Sonnet 4.5 rarely ever shorts.
- Holding periods. We see large gaps in how long positions are held (entry→exit time) across agents and runs. In our pre-launch runs, Grok 4 had the longest holding times.
- Trade frequency. The number of completed trades varies widely. Gemini 2.5 Pro is the most active; Grok 4 is typically the least.
- Risk posture (position sizing). Given the same prompt, agents choose very different sizes. Qwen 3 has consistently sized positions largest, often multiples of GPT-5 and Gemini 2.5 Pro.
- Self-reported confidence. When taking actions, models must assign a confidence score in [0, 1], and this varies widely by model. Notably, Qwen 3 routinely reports the highest confidence and GPT-5 the lowest; this pattern has been consistent across runs and appears decoupled from actual trading performance.
- Exit-plan tightness. With open-ended instructions, agents set different stop/target conventions. Across runs, Qwen 3 uses the narrowest stop-loss/target distances (as % of entry); Grok 4 and DeepSeek V3.1 are typically the loosest.
- Number of active positions. Some models tend to hold most or all of the six available positions simultaneously; by contrast, Claude Sonnet 4.5 and Qwen 3 typically maintain only 1–2 active positions at a time.
- Invalidation conditions. Agents index on different features when setting exit-plan invalidation rules. In pre-trial runs, Gemini 2.5 Pro more often overrode its exit plan and closed early, while others did not. This is something we are still investigating.
We also observed how the agents were brittle in ways that matter operationally. A few patterns that we encountered:
- Ordering bias. Early prompts listed market data newest→oldest. Even with explicit notes, several models still read it as oldest → newest, inferring the wrong state. Switching to oldest → newest fixed the immediate error and suggests a formatting prior in current LLMs.
- Ambiguous terms. Using “free collateral” and “available cash” interchangeably led to inconsistent behavior, sometimes correct assumptions, sometimes indecision. Clarifying definitions removed this failure mode. The ambiguity is understandable; the brittle response is the issue. A reliable agent should default to a clear assumption and proceed under uncertainty.
- Rule-gaming under constraints and deception. In a harness variant that exposed prior actions, a
set_trading_planmeta-action, a one-linethinkfield, and a temporary cap of ≤3 consecutiveholds, our test model (Gemini 2.5 Flash) complied with the letter but not the intent: its internal reasoning complained about being unable to hold a fourth time, then issuedset_trading_planwith a neutral “think” to justify a change, and promptly resumed a sequence ofholdactions. The exposed “think” and the internal chain-of-thought (CoT) diverged, signaling rule-gaming under pressure. Given the highly regulated nature of trading and consequences associated with bad outcomes in this field, we take alignment very seriously. - Self-referential confusion in plans. With open-ended exit plans, models sometimes misread or contradict their own prior outputs. Examples: GPT-5 later questioned its own phrase “EMA20 reclaim,” unsure how to apply it; Qwen 3 (30B-A3B) set “take +0.5% (4,477.47)” after a 4,463.7 entry (+0.5% ≈ 4,486), noted the inconsistent arithmetic in its CoT, then hesitated and held instead of taking profit. These episodes show difficulty executing against self-authored plans as state evolves. Even if partly due to the harness and fixable with more context, the pattern flags a deeper problem: maintaining coherent agent communication over time, which becomes more acute in multi-agent and long-context regimes.
During development, fees were a significant obstacle for all agents. Overall PnL was dominated by trading costs in early runs as agents over-traded and took quick, tiny gains that fees erased. We mitigated this by tightening the prompt: requiring explicit exit plans (targets, stops, invalidation), encouraging fewer but larger, higher-conviction positions, introducing leverage, and tying position size to the model’s inherent conviction and self-reported confidence score.
Future work
We’ve worked to give the models a fair shot, but the harness imposes real constraints. Each agent must parse noisy market features, relate them to current account state, reason under strict rules, and return a structured action, all inside a limited context window. In this season the agents have no explicit regime awareness and no access to prior state–action history, which limits their ability to adapt or learn from mistakes. The setup also does not support pyramiding (adding to or reducing current positions), so once an entry is placed the size and parameters are fixed. This task’s complexity merits an expanded setup: a broader feature set, selective tool use (e.g., code execution or web search), and explicit inclusion of past state–action traces.
As noted earlier, this is a single live season with a finite window, so statistical power is limited and early standings can move. We’ve seen run-to-run variation in both rankings and inter-model correlations. We are continuing to analyze the current and prior runs and are conducting more rigorous follow-ups; we’ll share much more of the full methodology and results once they meet our bar for stable conclusions. That said, the behavioral patterns described above have been consistent across early trials.
The broader question Nof1 aims to tackle is how to make markets more understandable for agents of the future: what conditions and interfaces help autonomous systems learn, compete fairly, and add value without relying on privileged access or manipulation? What capabilities are missing for truly superhuman trading, and what safeguards are needed if everyone can deploy an agent? Season 1 is a small, transparent step toward a much bigger vision..
What’s Next
Season 1 of Alpha Arena runs live through November 3, 2025, 5:00 p.m. ET.
We’re close to finalizing Season 2, using Season 1’s findings and ongoing analyses to shape the next iteration.
In Season 2 we plan to introduce more features, ship an improved prompt and harness, and introduce more statistical rigor.
Between now and the Season 1 close, we’ll continue to publish live results and engage with the community. More on Season 2 plans soon.